Adhoc Analysis
- This document is all about how to create an Adhoc Analysis Report. By using this section user can analyze the data without saving it or they can also download a copy of that analysis report if required.
Use Case:
- Make Adhoc Analysis report.
Prerequisite:
- You can use default dataset available with AIV Sales.cds to create analysis.
Steps to Create Adhoc Analysis
log in to the AIV application with your credentials & go to List View of the Adhoc Analysis section.
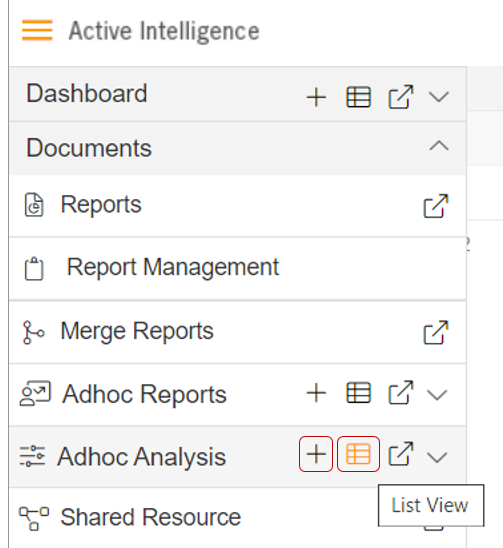
Click on Create Analysis icon from the bottom of the screen as shown below:-
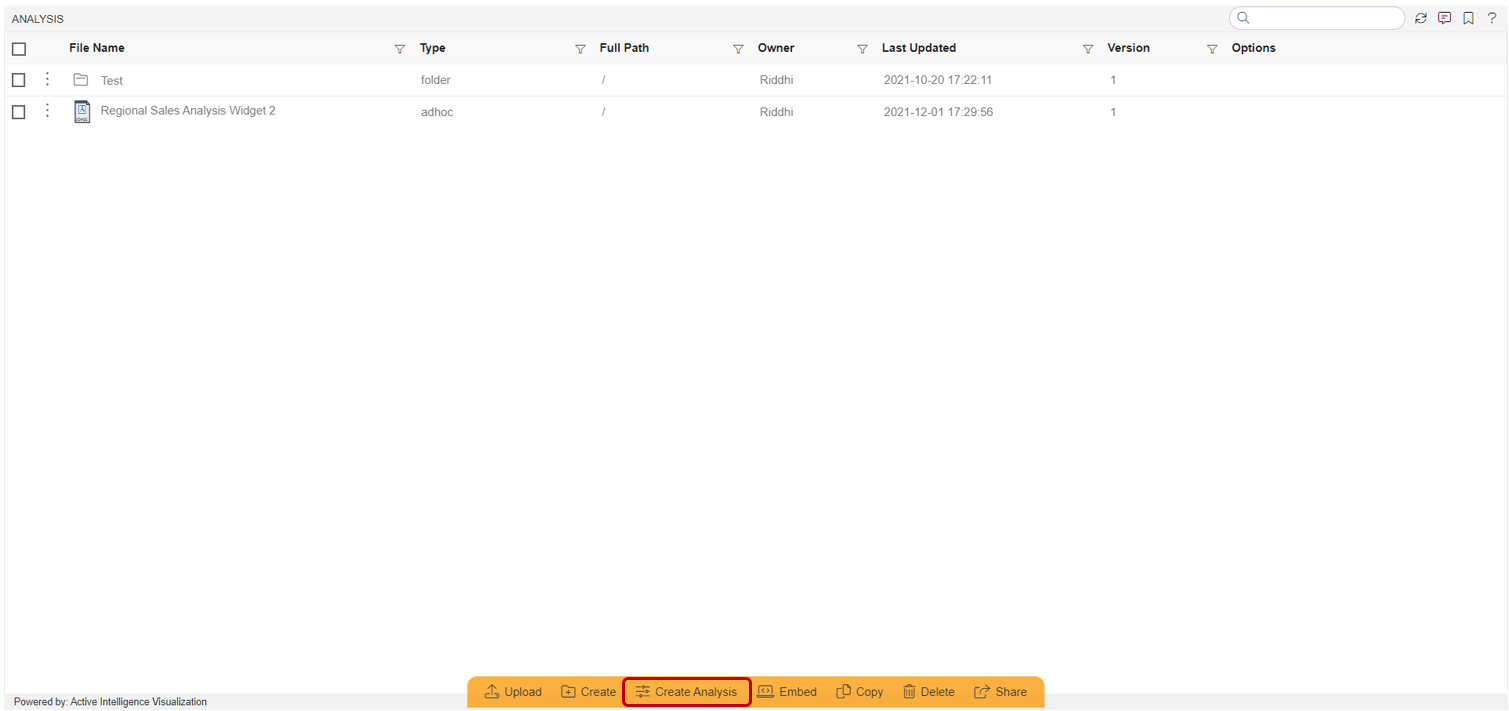
- There are three ways to create the Adhoc Analysis; From the bottom of the screen, from the context menu & ‘+’ icon as shown in the 1st image.
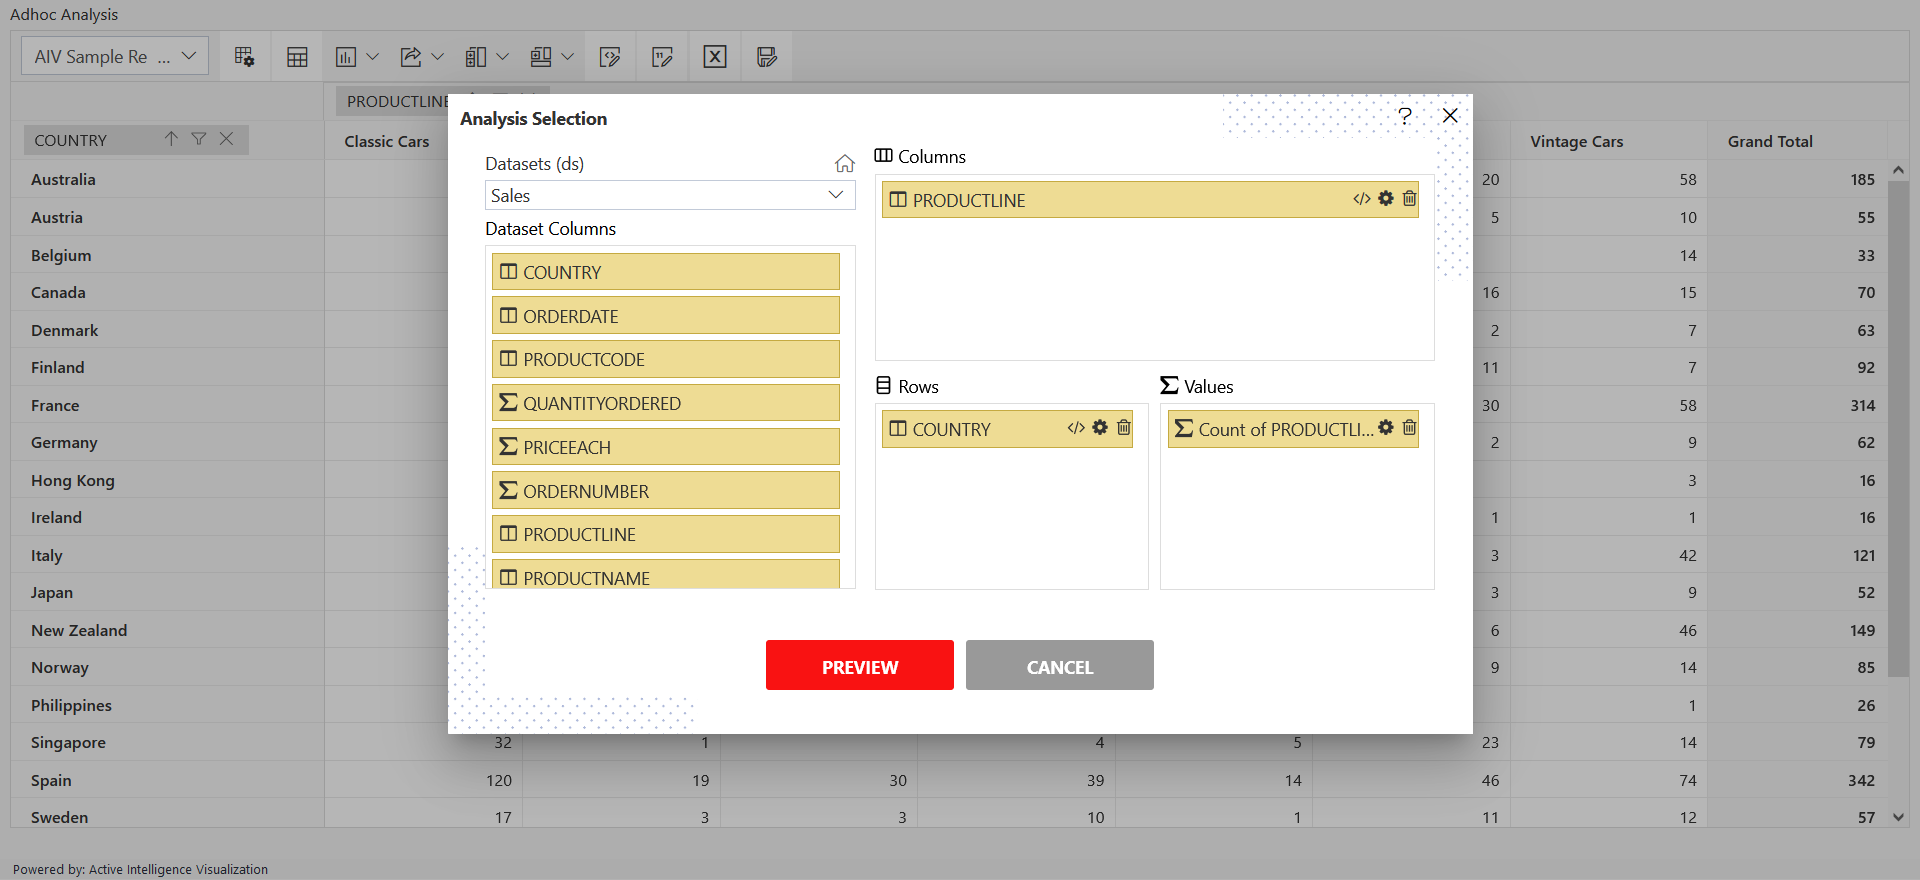
Analysis section will appear & it will look as per the image below:-
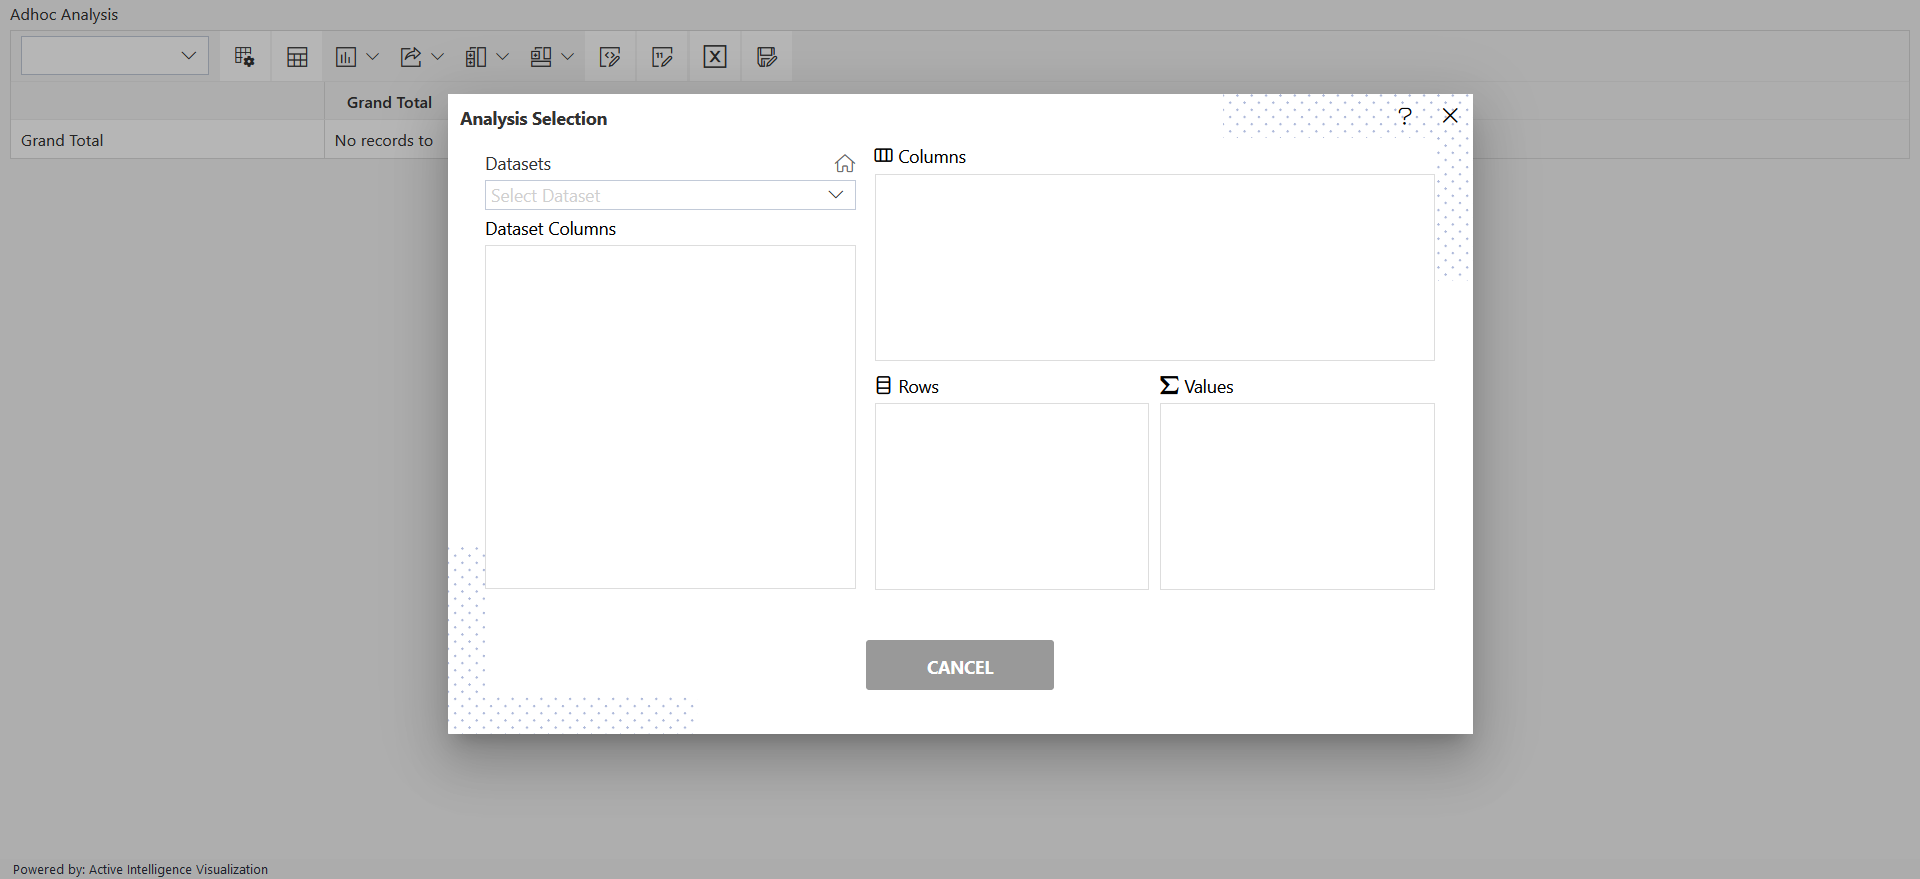
- Analysis section:- By this user can select the data for the analysis.
- Enter the given details in the analysis section box:-
- Dataset: Sales.cds
- Columns: drag & drop productLine column from the Dataset Columns to Columns.
- Rows: drag & drop country column from the Dataset Columns to Rows and Productline in Columns and Productline in Values.
When user drag & drop Productline in Values it will show a smaall box asking for Type. Set it as Count Type.
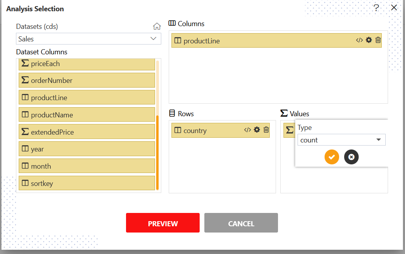
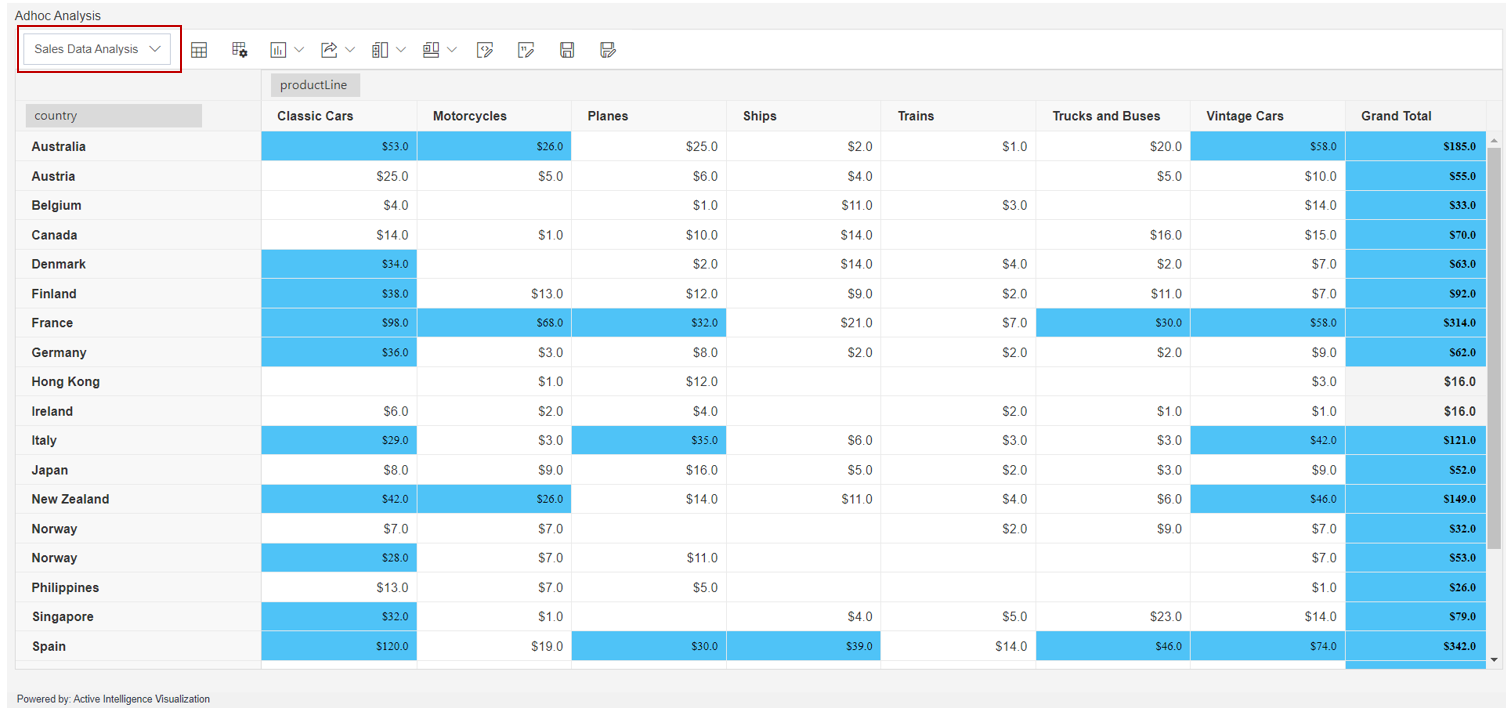
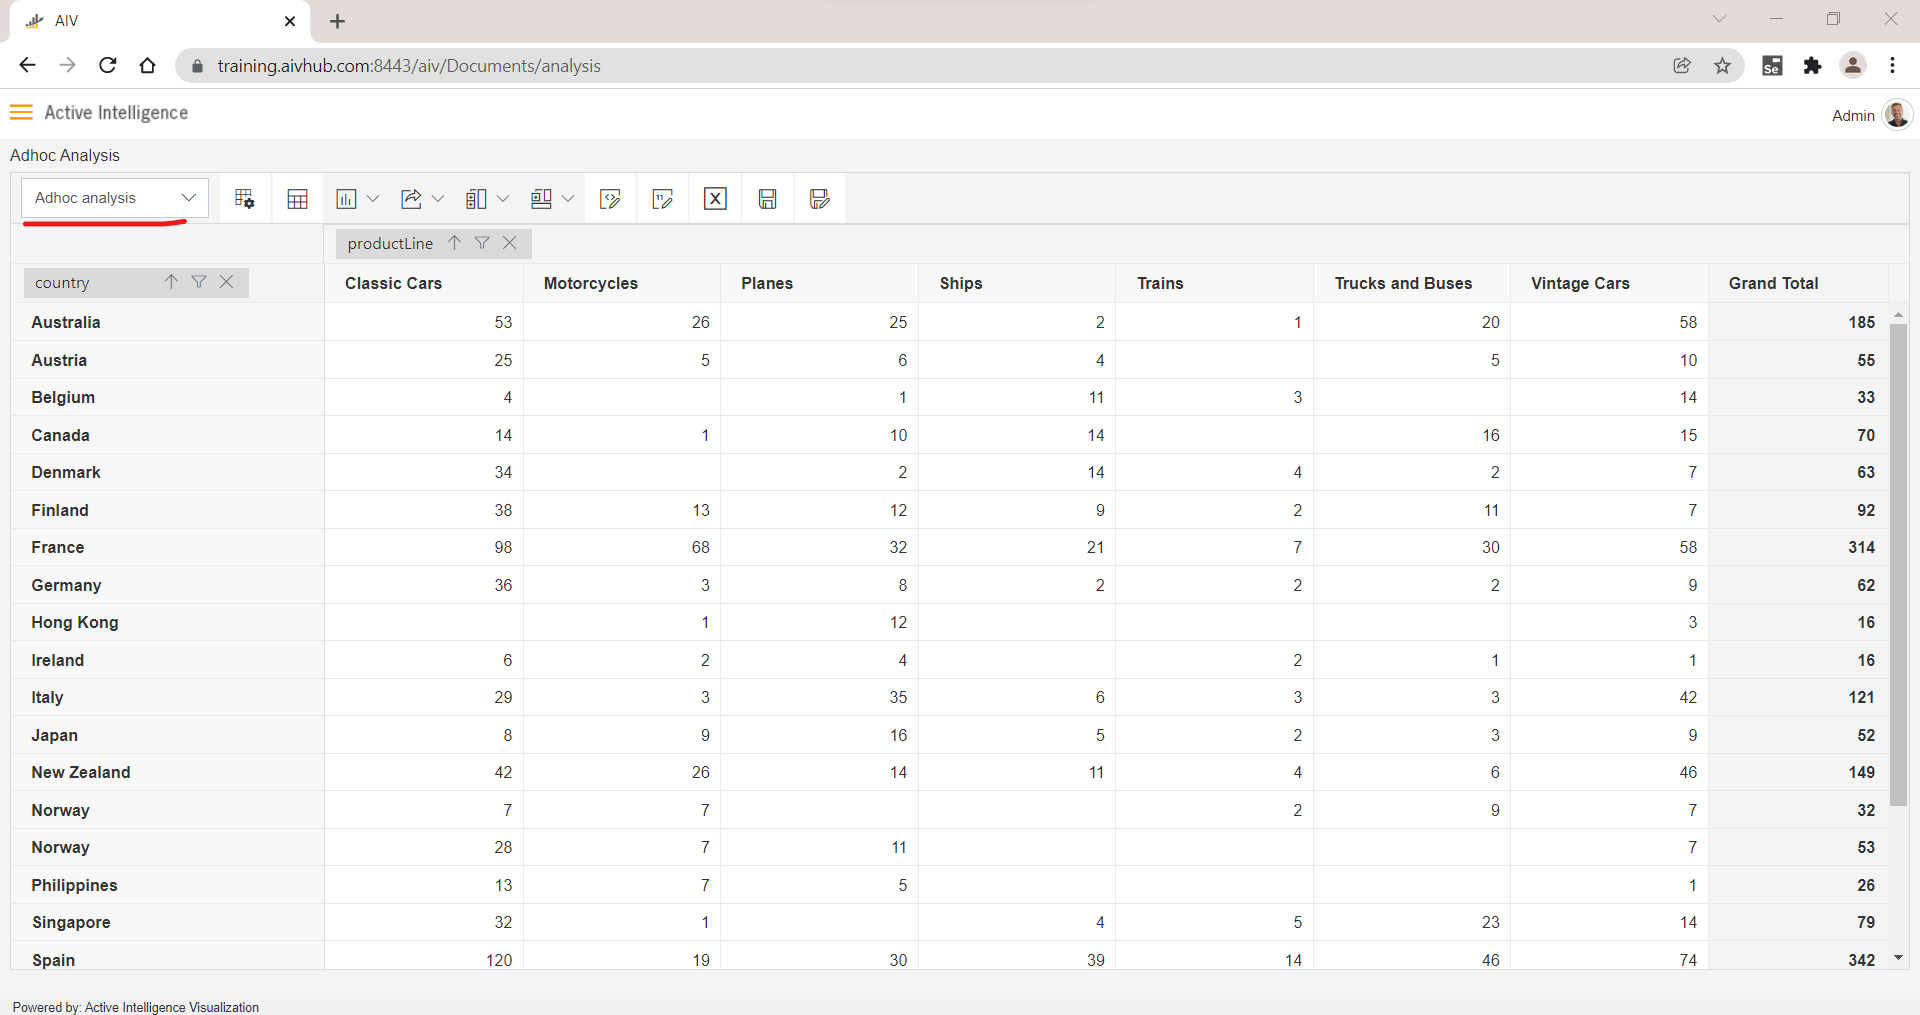
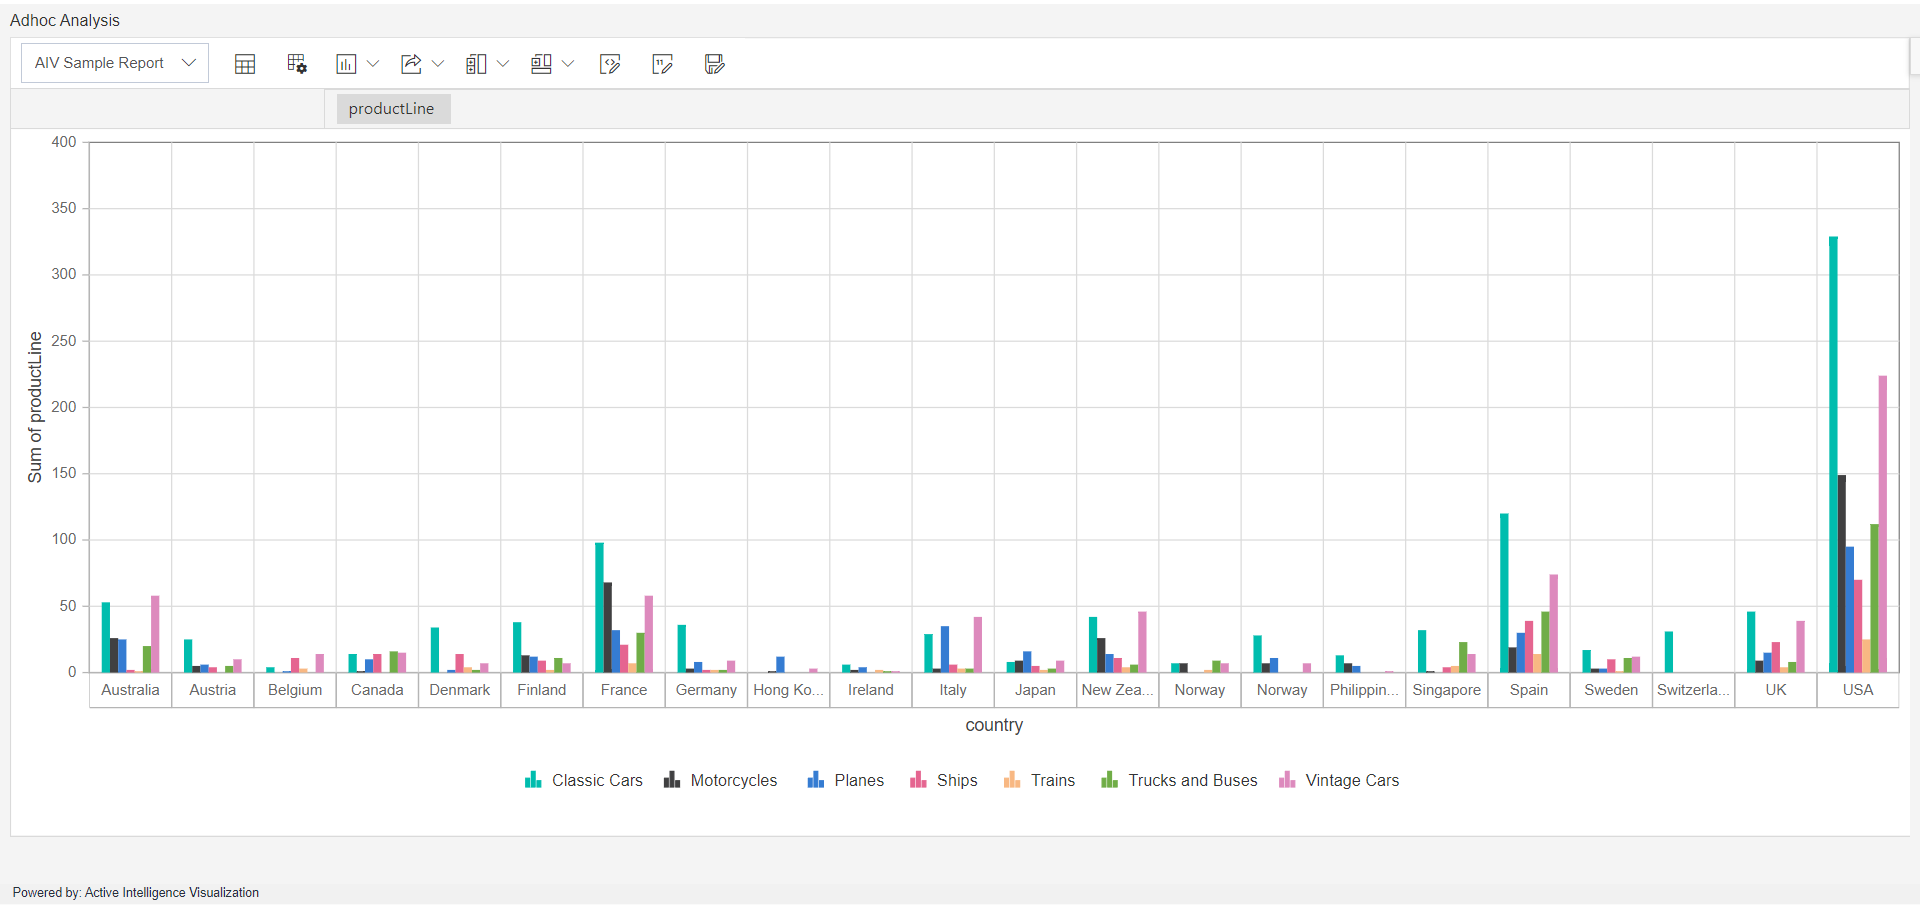
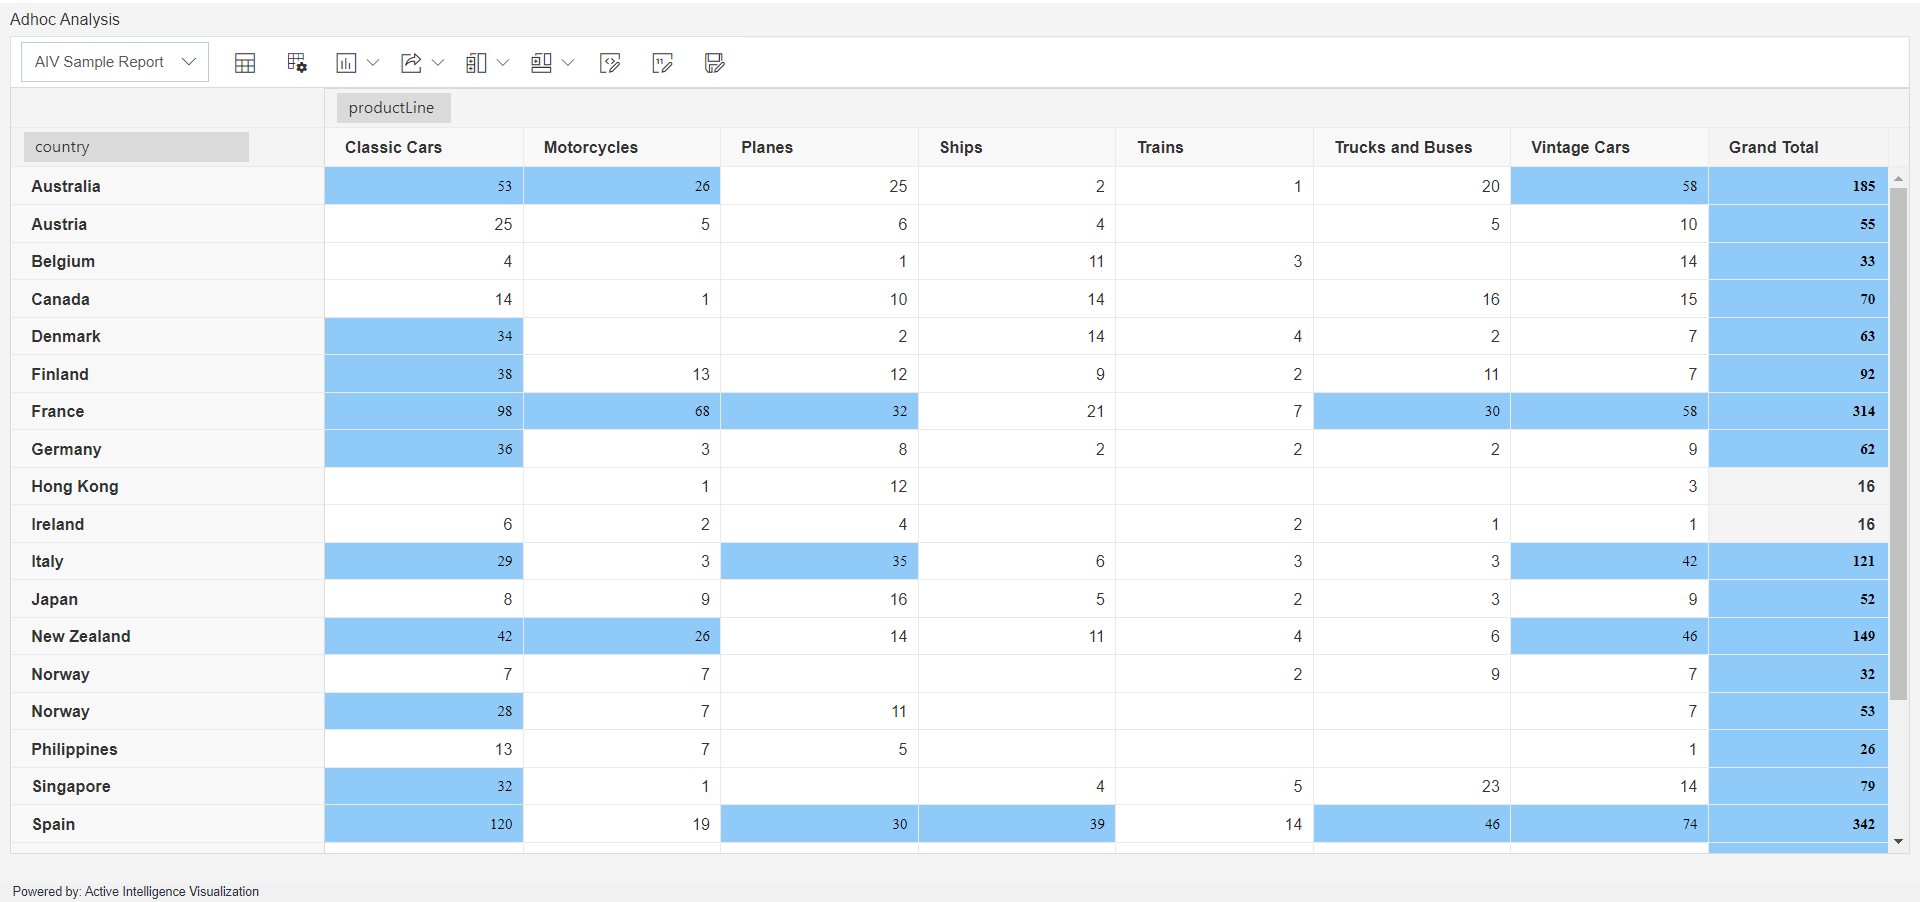
Click on Preview & cancel button respectively. Your screen will look as per below:-
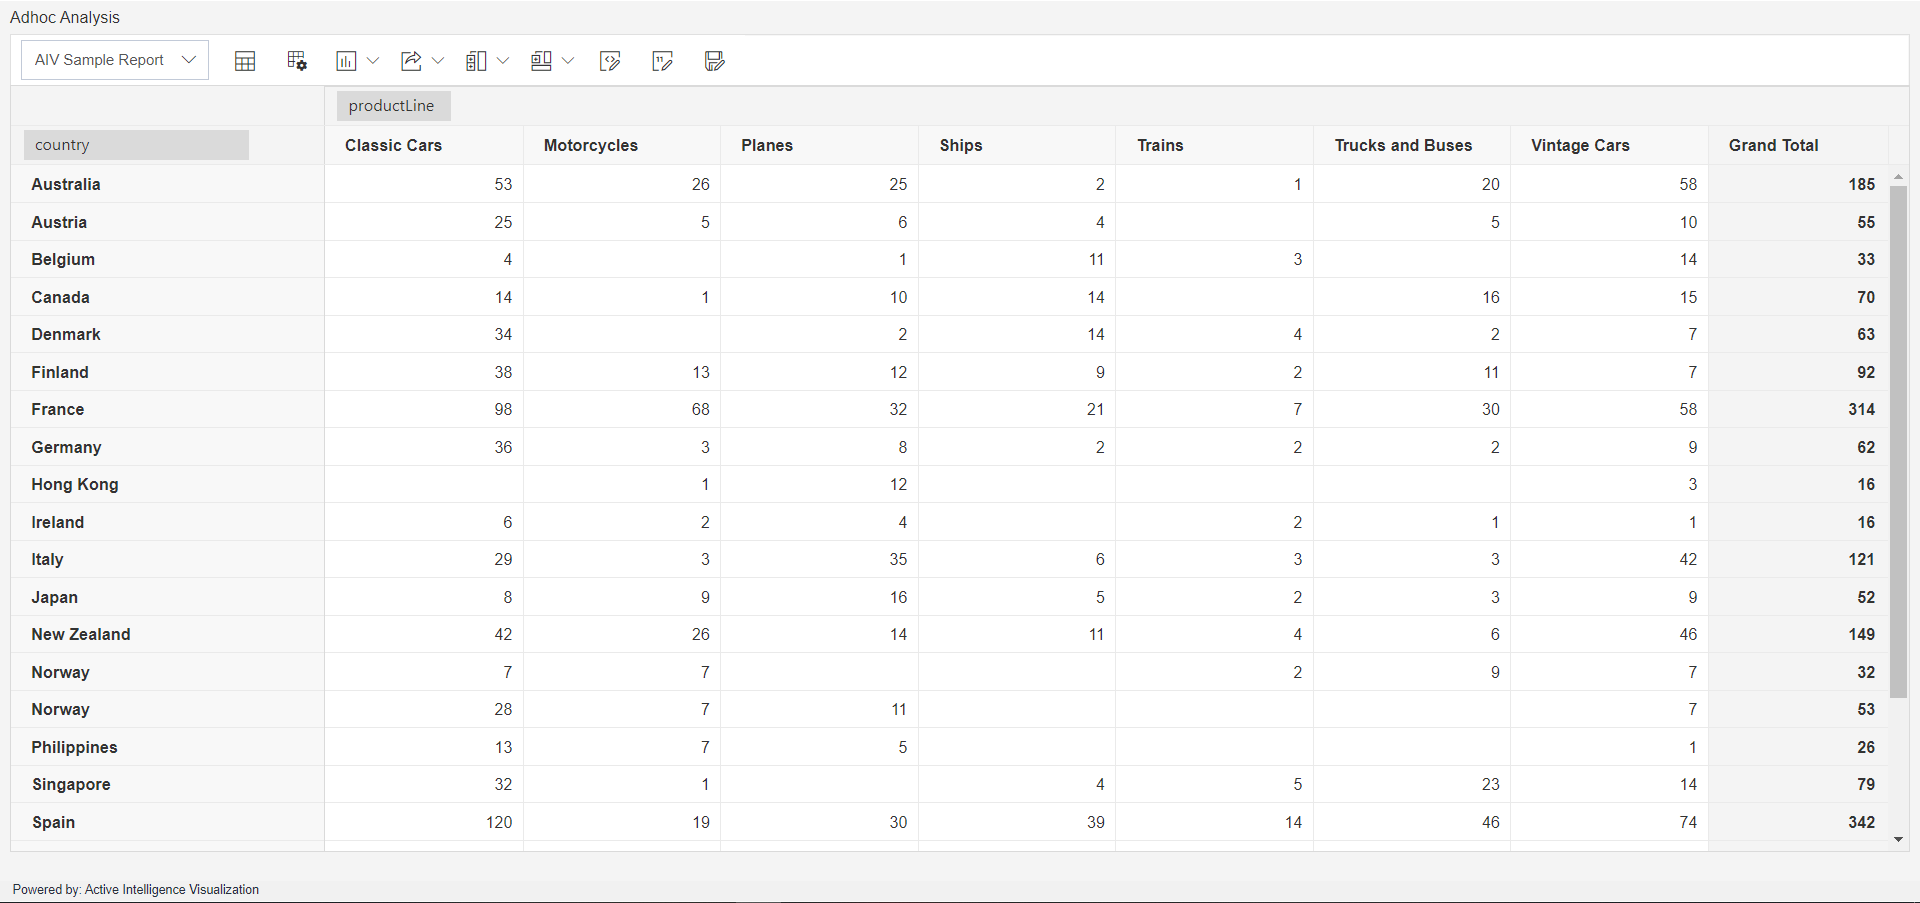
As the user see will see in the above image the analysis has a default name as AIV Sample Report.
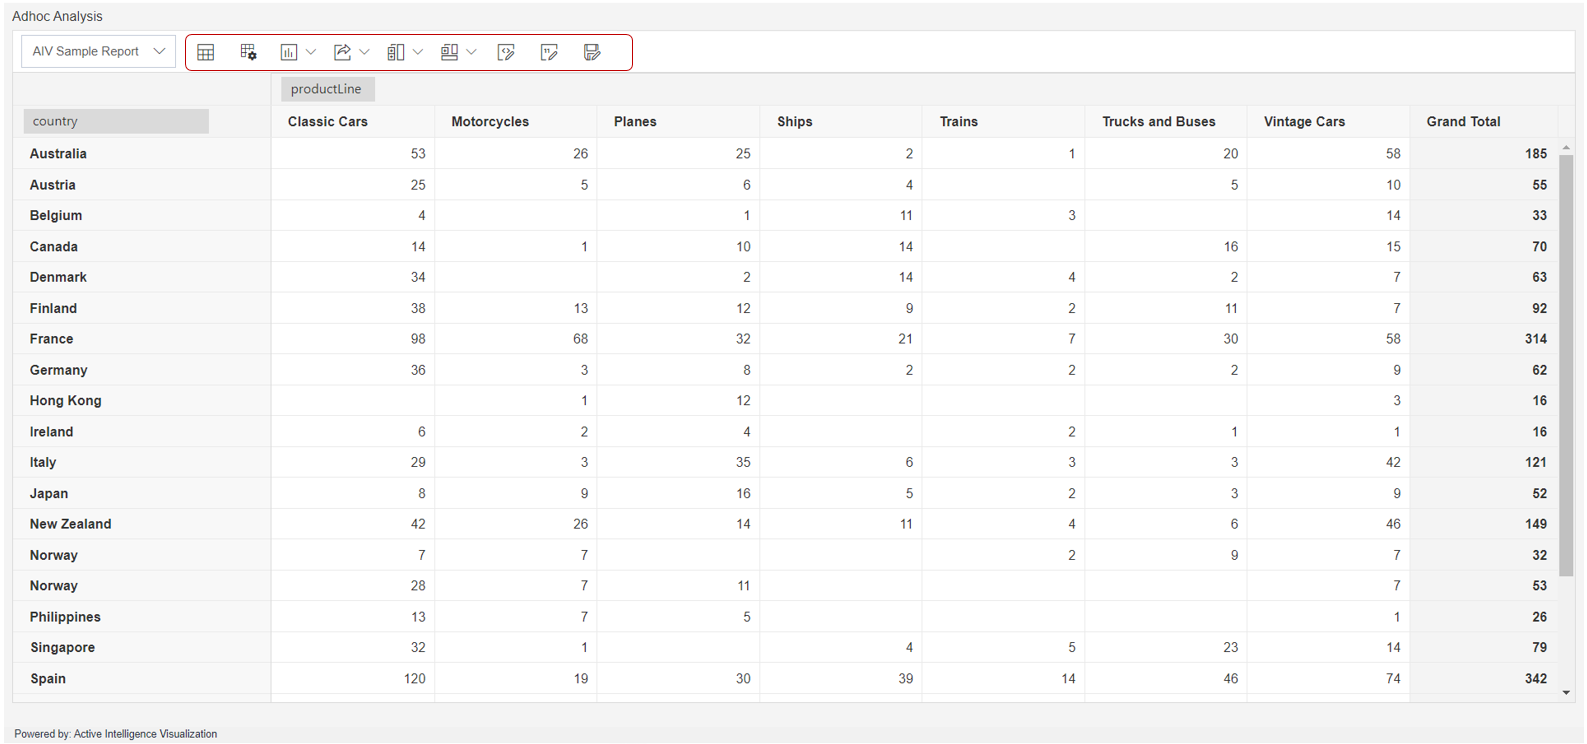
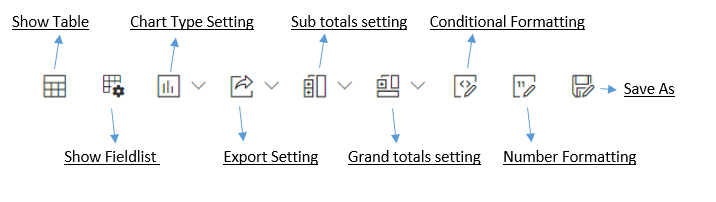
As per user requirements they can make changes in the analysis from the icons given at the top left corner of the analysis as shown below:
Save As
Initially Adhoc analysis will be created with name 'Sample Report', in order to save created analysis there is save as icon available as you can see in above image.
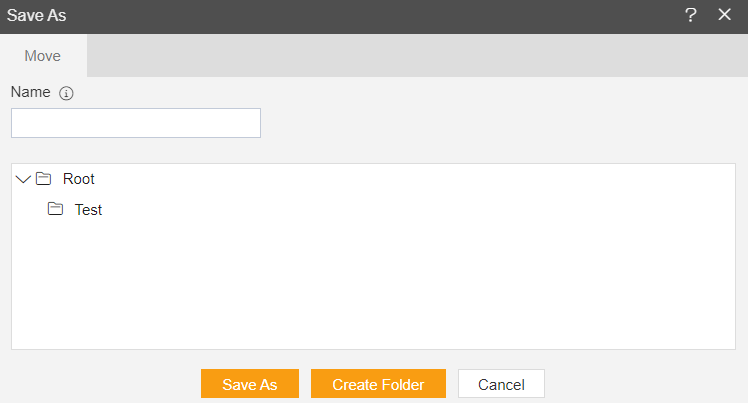
Click on Save as button to save analysis, you will see a save as window as in below image,
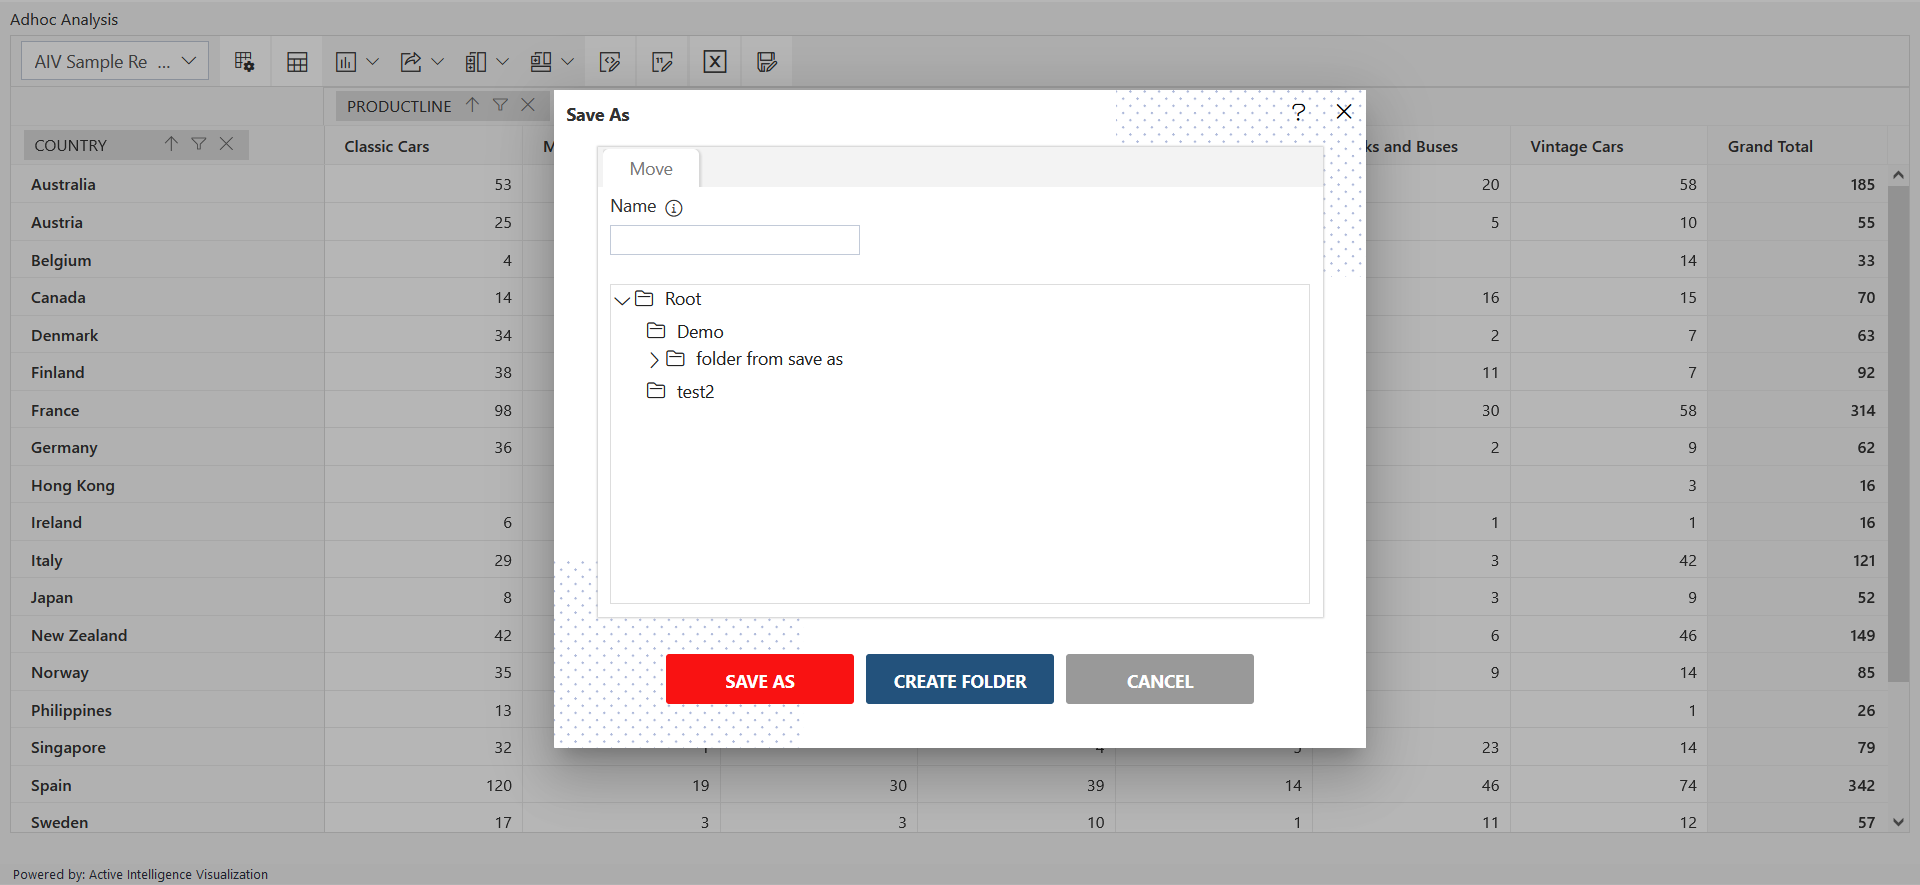
Provide Unique name of analysis, select folder from the tree view displayed just below of name field and click on Save as button. User can see success message once analysis is saved.
If user wants to create folder from the save as window, there is button to create new folder given next to save as button.
Now you can see given analysis name is displayed in Analysis list as shown in below image,
When a user clicks on the Show Fieldlist option your screen will look as per the image below:-
By using the Show Fieldlist option,
 user can change the entered data from which they have created analysis.
Now click on the Chart Type Setting option, the user will be able to see the below drop-down:-
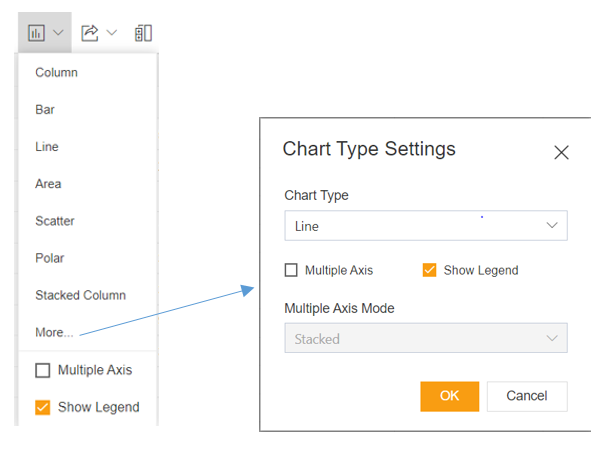
It will show many other chart options as the user selects on the ‘More’ from drop-down & it will look as per the above image.
Enter details as per below:-
- Chart Type: Column
- Show Legend: by default it is checked, the user can uncheck it if required
Click on the OK button & your analysis window will look as per below:-
When the user clicks on the Show Table icon, it will again show the table in the analysis window.
User can export analysis in given formats by clicking on Export Settings. It contains PDF, Excel, CSV, PNG, JPEG & SVG.
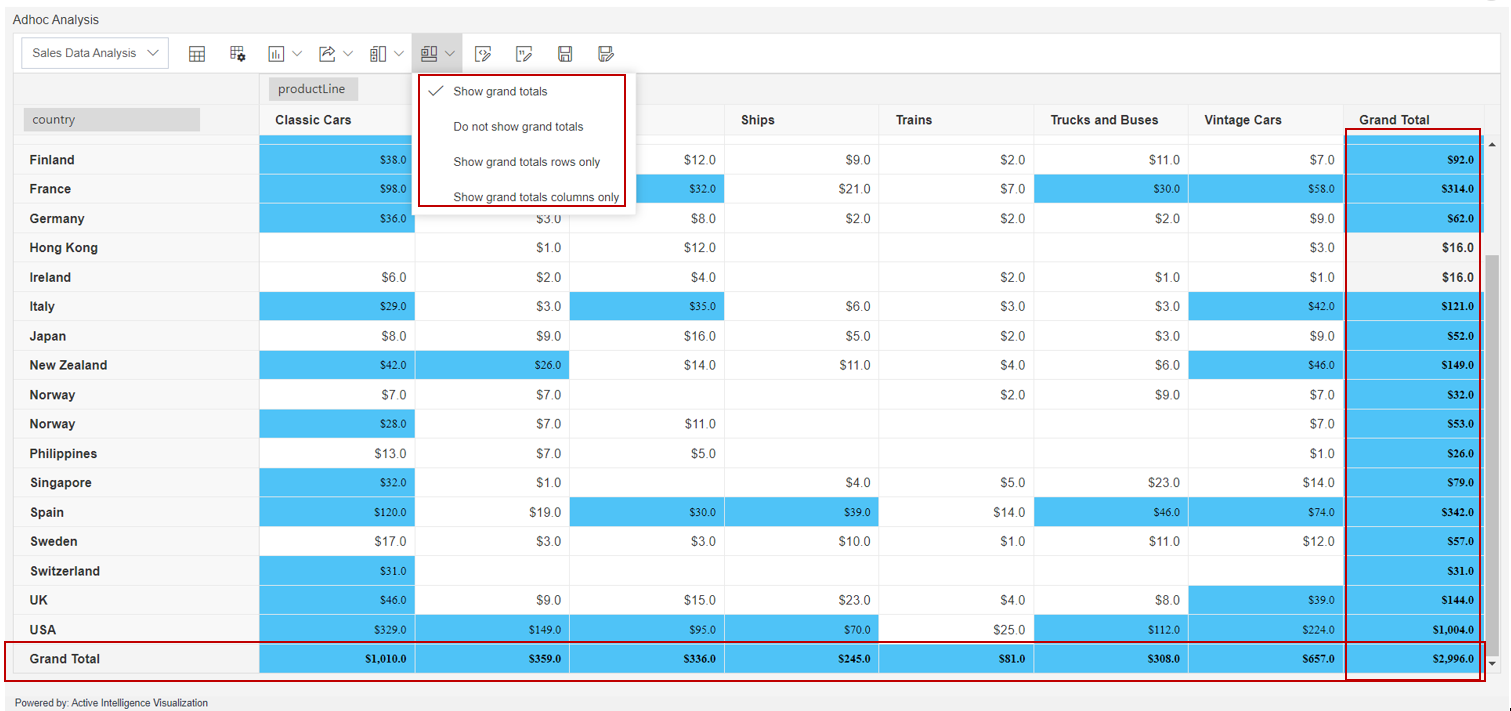
By using Show grand totals from the drop-down, your analysis screen will look as per the image below:-
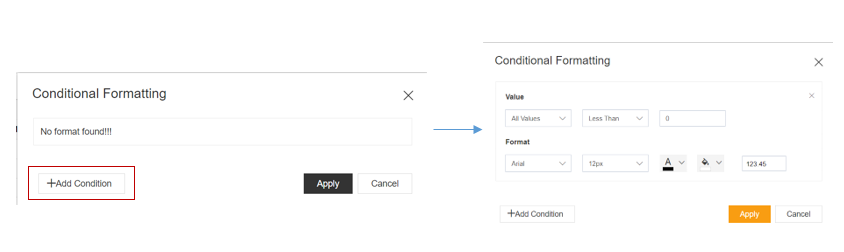
When a user clicks on the Conditional Formatting option > Add condition, it will look as per the image below:-
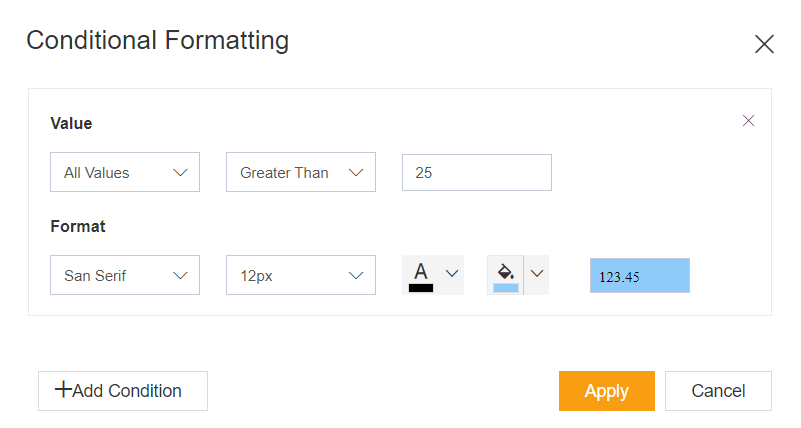
Enter the details as shown in the image below:-
When a user clicks on apply button, your analysis screen will look as per below:-
By using the Conditional Formatting option users can make changes in the formatting of the table cells as required. Users can also add more than one condition in one table.
When a user clicks on the Number Formatting option it will look as per the image below:-
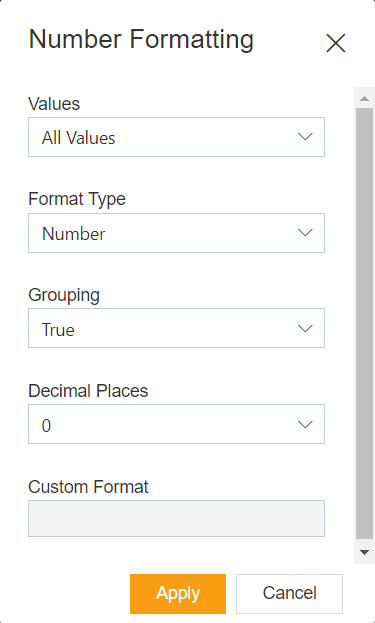
- Values: It has 2 options in the drop-down All Values & productLine. Users can select the option as required.
- Format Type: Contains 4 options in the drop-down. Number, Currency, Percentage & Custom. Users can select any of these options as required.
- Decimal Places: User can set the position of a digit to the right of the decimal point.
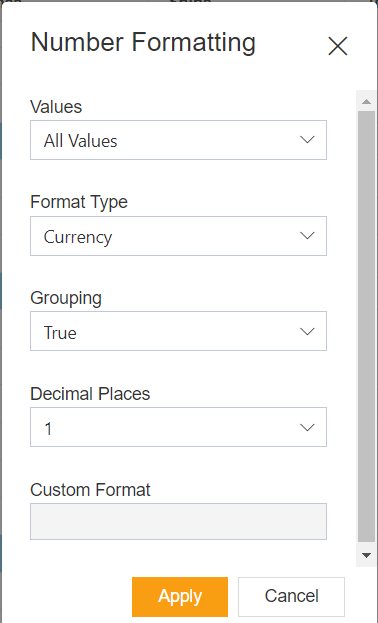
Enter the details in the Number formatting menu as shown in the image below:-
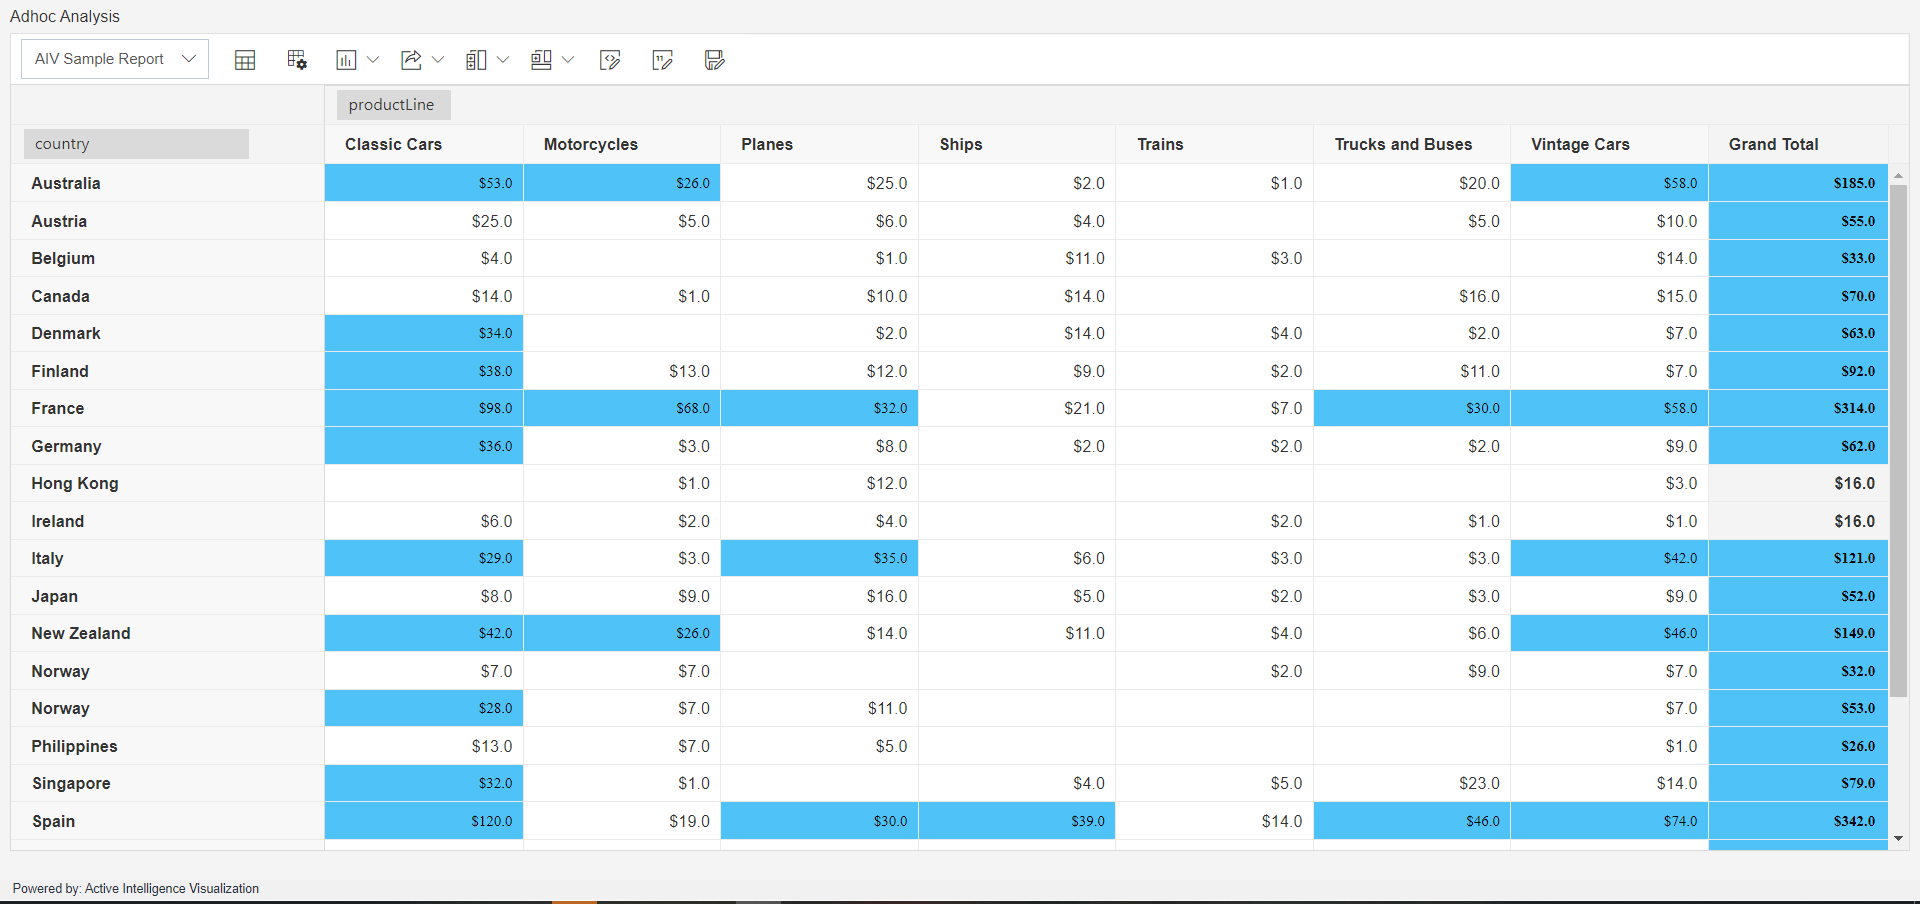
When a user clicks on the apply button, your analysis screen will look as per below:-
Click on Save As option, & one pop-up will appear on your screen as below:-
Give a required name to the analysis in the Name box & select the folder where you want to save the analysis. (For this example will give name: Sales Data Analysis)
Select the folder from the Save As window, if you want to Save File at desired folder. (For theis example; we not selected the folder)
When the user clicks on Save As an option, the analysis report will be saved automatically to the Adhoc Analysis section.
One more option Save will appear next to the Number Formatting option.
User can see the analysis name has been changed to Sales Data Analysis from AIV Sample Report.